Courses: Introduction to GoldSim:
Unit 17 - Creating Dashboards and Player Files
Lesson 8 - Dashboard Button Controls
The Button control is perhaps the most versatile of all of the Dashboard controls. It allows you to link one of a large number of actions to a button that is placed on the Dashboard:
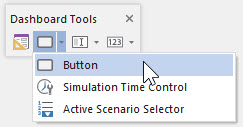
Let’s begin by starting with a new model, inserting a Dashboard and entering the Dashboard. Next, insert a Button control to the Dashboard and double-click on it. The dialog looks like this:
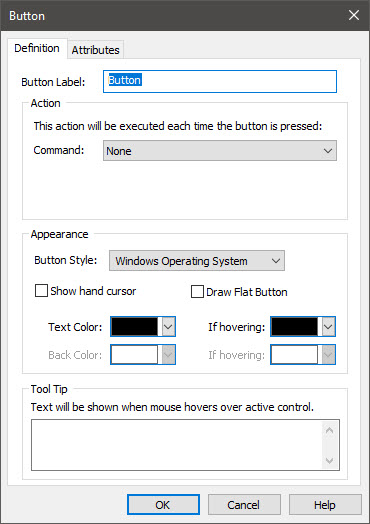
The two key fields here are the Button Label and the Command. The Button Label is the text that appears on the button in the Dashboard. The Command determines what action will be executed when the button is pressed. GoldSim provides a list of possible actions:
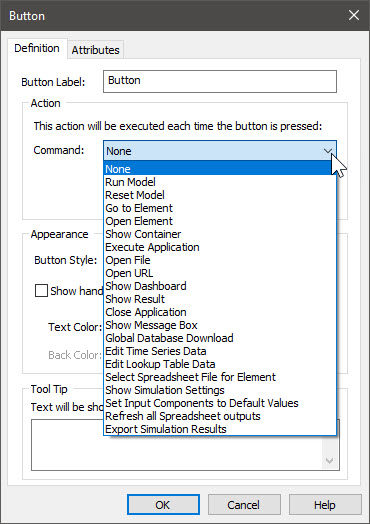
Depending on the action selected, one or more additional fields may be required in order to specifically control how the Button behaves. For example, if you select the “Show Dashboard” command, one additional field is provided to allow you to enter the name of the Dashboard element.
We won’t explore all of the options (they are all described in detail in GoldSim Help). Rather, we will examine a simple example that uses several of them.
Let’s start by opening the file Example38_PredatorPrey_Dashboard.gsm. You will find it in the “Examples” subfolder of the “Basic GoldSim Course” folder you should have downloaded and unzipped to your Desktop.
This is one of the predator-prey models we discussed in Unit 8, Lesson 12. It has been modified slightly from the model we originally looked at (it is now run for multiple realizations), and to facilitate this, several Distribution Result elements have been added. In addition, a number of Data elements have been added (for simplicity, the original model buried some inputs inside Expressions), and two Dashboards have been added. The Data elements (and other inputs) are inside an Inputs Container, and the model itself is inside a second Container:
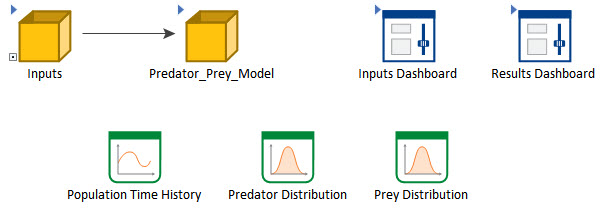
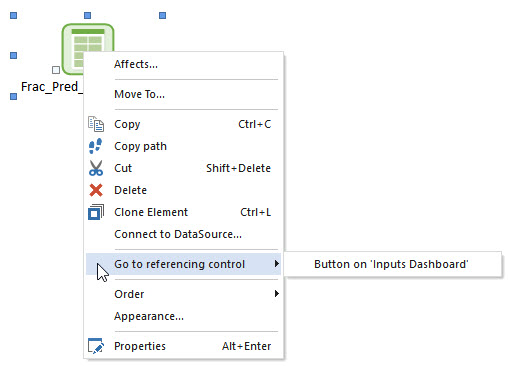
If you go to the Inputs Container, and right-click on any element, you will see an option to Go to referencing control, indicating that it is linked to a Dashboard control:
Let’s first look at the Dashboard named Inputs Dashboard. Enter that now:

You will see that this Dashboard contains some text and images, a Text Box, a Hyperlink and an Input Grid. You can explore these if you want. However, we are going to focus on the six Button controls in this Dashboard.
In the lower left side of the Dashboard are three Buttons. Double-click in the first one (Unit Predation Rate):
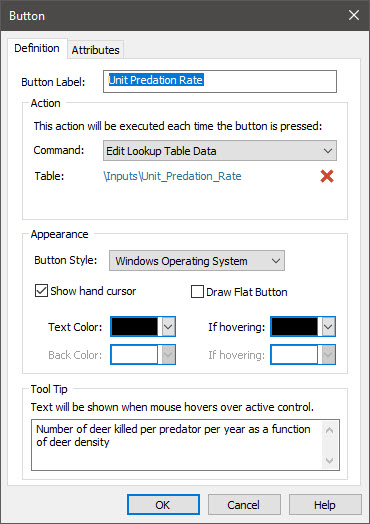
Note that the Command for this Button is to “Edit Lookup Table Data”. The two buttons below have the same Command (but are linked to different tables). Close the dialog and place the Dashboard in Active view. Recall that you toggle between Design view and Active view using this button:

Now press the Unit Predation Button. You will see that it opens up the Lookup Table for editing:
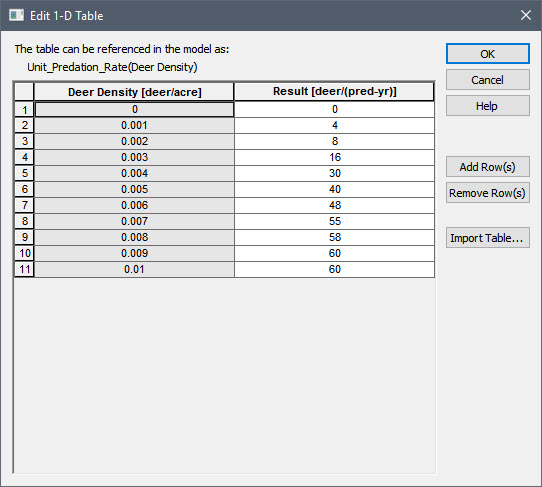
Close the Lookup Table dialog and return to Design View. Now look at the three buttons above the image of the deer. If you double-click on Explore Model, you will see that the Command is “Show Container”. Pressing this button jumps to the specified Container (in this case it is simply “\”, referring to the top level Model Container). Toggle back to Active View and press Explore Model. You will see that you will jump to the top level Container in the model.
Return to Design View and enter the Inputs Dashboard again so we can look at the remaining buttons.
If you double-click on Run Model, you will see that the Command is “Run Model”. This is equivalent to pressing the Run button in the toolbar. If you double-click on View Results, you will see that the Command is “Show Dashboard”. Pressing this button jumps to the specified Dashboard.
Place the Dashboard in Active View again, and press the View Results button. You will jump to the other Dashboard:
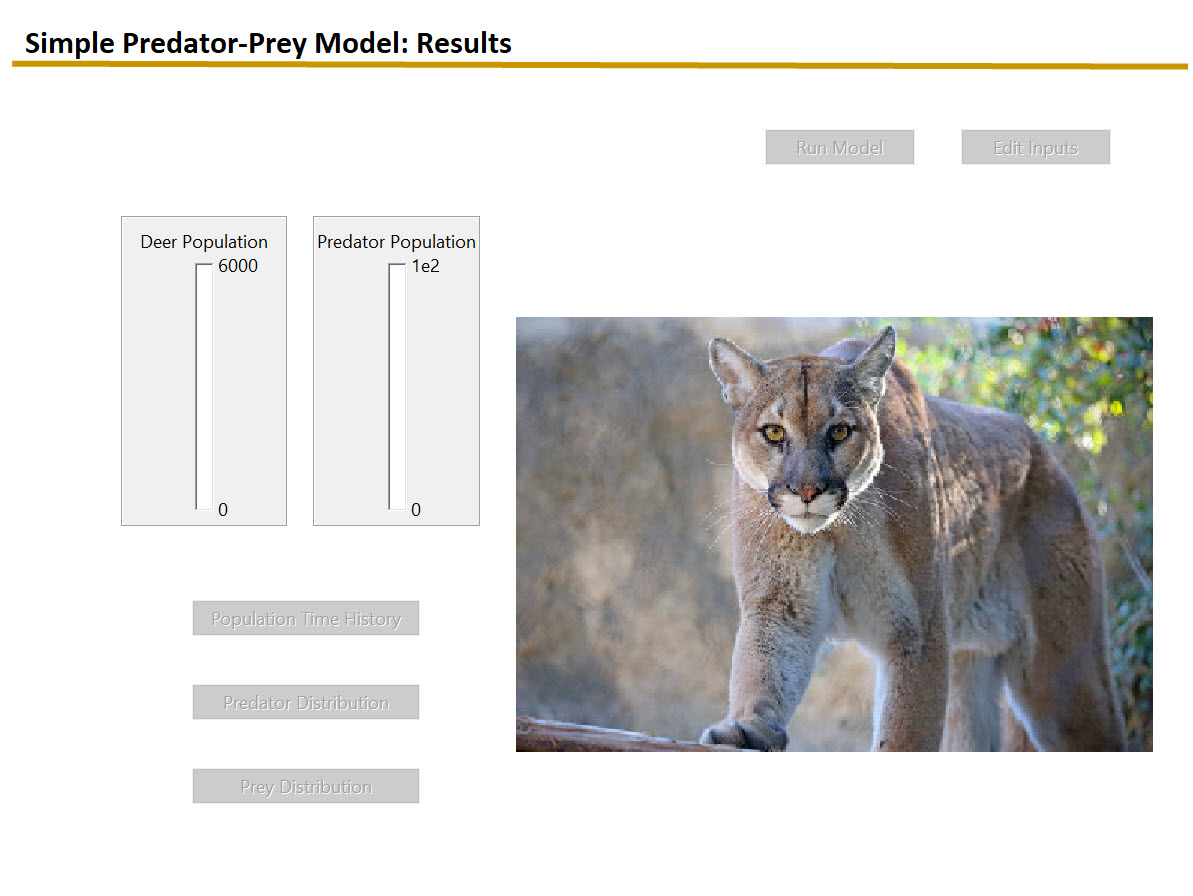
You will see that this Dashboard contains some text and images and two Thermometers. You can explore these if you want. However, we are going to focus on the five Button controls in this Dashboard.
The two buttons above the image of the cougar are identical to the analogous buttons on the Inputs Dashboard. The first runs the model, and the second jumps to the other Dashboard.
In the lower left side of the Dashboard are three Buttons. Double-click in the first one (Population Time History):
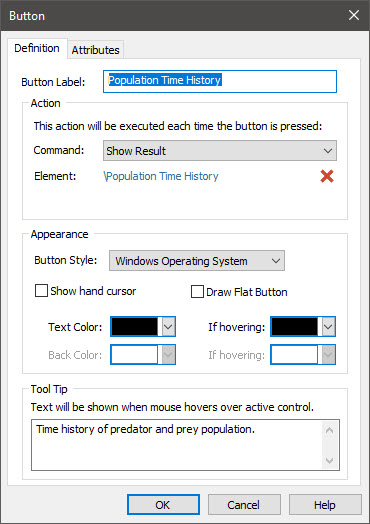
Note that the Command for this Button is to “Show Result”. Like the Result Window control in the previous Unit, for this Command we must reference a Result element. In this case, we have referenced the Time History Result element (named "Population Time History"). The two buttons below have the same Command (but are linked to different Result elements). Close the dialog and place the Dashboard in Active view. Then run the model (by either pressing the Run button in the toolbar or the Run Model button on the Dashboard) and press the Population Time History button. You will see that a time history result is displayed.
This Lesson should have provided you with an overview of the most common things that Button controls are used for (i.e., jumping between Dashboards, jumping to a Container to explore the model, displaying result charts, editing Lookup Tables, running a model). You are encouraged to take some more time to experiment with the Button control options (e.g., changing their appearance). You may also want to look at the other Input and Output controls in the two Dashboards.
Note that all of the Button controls have a separate tab (Attributes). Don’t worry about that yet. We will discuss that tab in a later Lesson.
