Courses: Introduction to GoldSim:
Unit 17 - Creating Dashboards and Player Files
Lesson 7 - Dashboard Output Controls
Now that we have explored the various input controls, in this Lesson, we will look at the output controls:
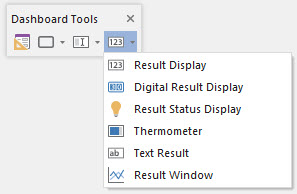
Let’s start by opening the file Example37_Output_Controls.gsm. You will find it in the “Examples” subfolder of the “Basic GoldSim Course” folder you should have downloaded and unzipped to your Desktop.
You will see that the file consists of a very simple dynamic model with a velocity (represented by a Time Series element) being integrated by an Integrator element to compute the distance traveled as a function of time:

The purpose of output controls is to display the outputs of a GoldSim model. Hence, unlike an input control (which can be linked to only Data elements), an output control can be linked to the output of almost any kind of element.
In this model, the output of the Integrator is linked to five of the six types of output controls in a Dashboard. A Time History Result element (which references the Integrator) is linked to a sixth type of output control (the Result Window).
Note: Although outputs can be linked to multiple types of output controls, Data elements can only be linked to one type of input control at a time.
Right-click on the Integrator and choose Go to referencing control. You will see that it is linked to five different types of output controls:

Select the first one to jump over to the Dashboard now:
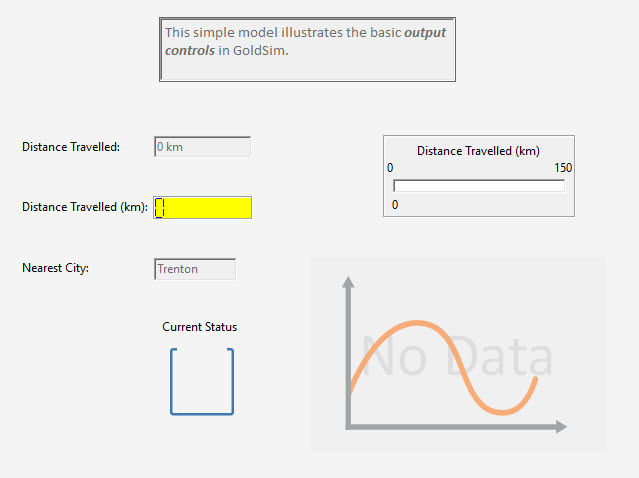
Let’s briefly explore each of the controls. After doing so, we will place the Dashboard in Active view and run the model to see how they actually behave.
The control in the top left-hand corner is a Result Box (also called a Result Display). Double-click on it now:
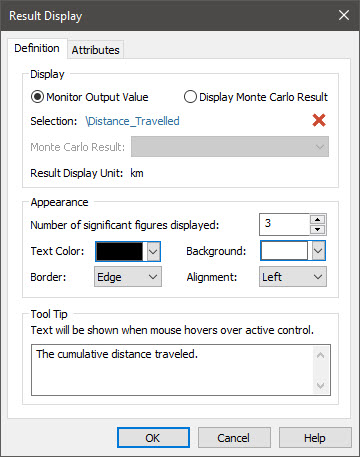
This is a very simple output control. It simply displays the value (along with the units) of the output. There is no built-in label. As a result, when you use this control, you will typically add a Text object (as has been done here) to specify what the result represents. (Of course, you can also specify this information in the Tool Tip.)
At the top of the dialog, you will notice the choice to Monitor Output Value or Display Monte Carlo Result. In fact, this choice is available for all five types of output controls. Monitor Output Value is the default, and will display the actual value of the current realization of the selected output. This would most commonly be selected if you were running only a single realization. (If you were running multiple realizations, at the end of the simulation, it would display the final value of the final realization.)
If you are running a Monte Carlo simulation, in most cases Display Monte Carlo Result should be selected when using an output control. When you do so, you can only select a Distribution Result element (rather than a specific output of some other element). You then select a statistical result (based on all the realizations) to display:
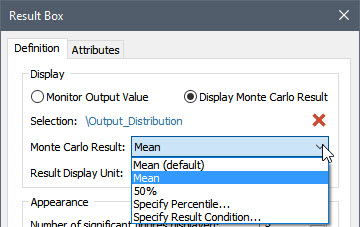
We will explore this in an Exercise in a subsequent Lesson. In this example, we will only run a single realization, so Monitor Output Value will be selected for all controls.
The next control down (the one with the yellow background) is a Digital Result Display. It is essentially identical to the Result Display with two exceptions: 1) it’s appearance is “digital” rather than text; and 2) the display does not include units (and hence you typically would need to provide these as part of an associated Text object).
The next control (labeled “Nearest City”) is a Text Result. Double-click on it now:
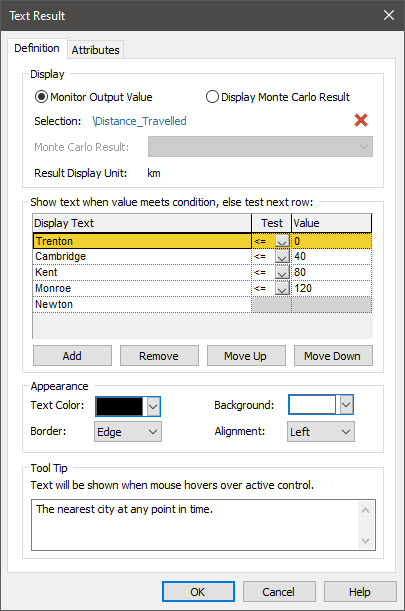
The Text Result control allows you to display one of a series of user-specified text strings based on the value of an output.
In this particular example, we are doing the following:
- If the output is <= 0 km, display “Trenton”;
- If the output is > 0 km but <= 40 km, display “Cambridge”;
- If the output is > 40 km but <= 80 km, display “Kent”;
- If the output is > 80 km but <= 120 km, display “Monroe”;
- If the output is > 120 km, display “Newton”.
There is no built-in label. As a result, when you use this control, you will typically add a Text object (as has been done here) to specify what the result represents. (Of course, you can also specify this information in the Tool Tip.)
The next control (labeled “Current Status”) is a Result Status. Double-click on it now:
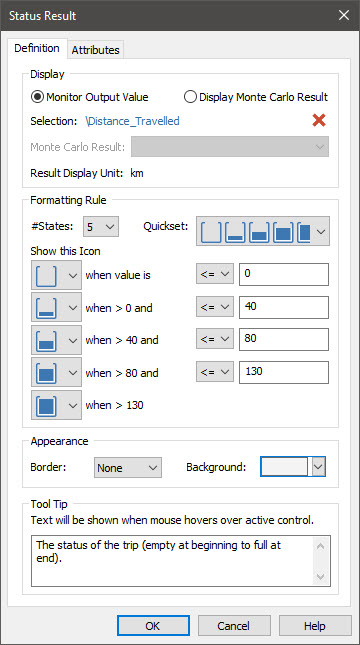
The Result Status control allows you to display one of a series of user-specified images based on the value of an output. In this regard, it is similar to the Text Result (which displays text instead of images). GoldSim provides a number of possible built-in images. In this particular example, we are using an image consisting of four stacked disks, and are doing the following:
- If the output is <= 0 km, all disks are gray;
- If the output is > 0 km but <= 40 km, one disk is blue;
- If the output is > 40 km but <= 80 km, two disks are blue;
- If the output is > 80 km but <= 130 km, three disks are blue;
- If the output is > 130 km, all four disks are blue.
There is no built-in label. As a result, when you use this control, you will typically add a Text object (as has been done here) to specify what the result represents. (Of course, you can also specify this information in the Tool Tip.)
The control on the upper right side of the Dashboard is a Thermometer. Since we have already discussed this in a previous Lesson, we won’t do so now.
The last control (in the lower right side of the Dashboard) is a Result Window. Double-click on it now:
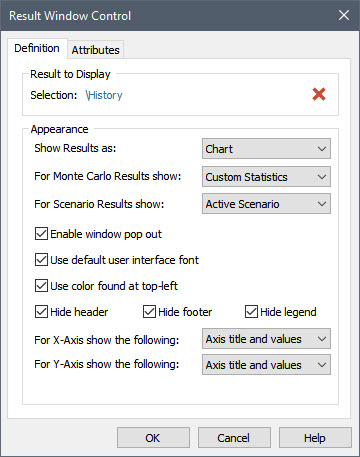
The Result Window control allows you to display (embed) a result chart or table directly in the Dashboard. It does this by allowing you to reference a Result Element. In this case, we have referenced the Time History Result element (named "History") that displays the output of the Integrator.
Now that we have looked at all of the output controls, let’s place the Dashboard in Active view and run the model to see how they actually behave. Recall that you toggle between Design view and Active view using this button:

Place the Dashboard in Active View now.
This particular model is set to run for a Duration of 2 hours with a 10 minute timestep (i.e., a total of 12 timesteps). If we were to run the model now, it would run essentially instantaneously (since it is so simple), so all of the controls would simply reflect the value of the Integrator at the end of the simulation. To make things a bit more interesting, therefore, we are going to step through the simulation one timestep at a time. The Run Control toolbar has buttons that allow you to pause and restart the simulation, as well as step through the simulation one timestep at a time (with the simulation pausing between timesteps). While paused, you can view the results and explore the model. Moreover, you can also modify input controls while a simulation is paused.
To step through the simulation now, simply repeatedly press this button:

Note: You can observe the status of the simulation (e.g., the simulated time) in the Status bar at the bottom of the window.
When you do so, you will see the various output controls changing. Here is what the Dashboard looks like halfway through the simulation:
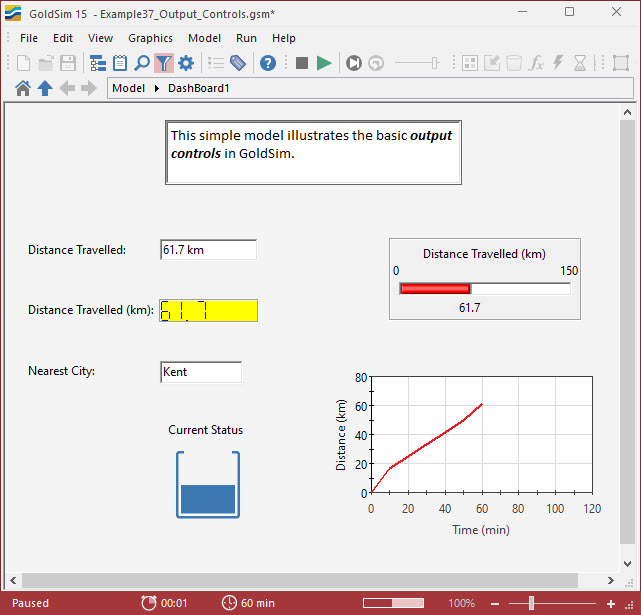
Note: In addition to stepping through and pausing a simulation, you can also slow it down. By combining this with various output controls (in particular, Result Status Displays and Text Results), you can create simple animations in a Dashboard illustrating how the state of the system evolves during a simulation.
This Lesson should have provided you with an overview of what all of the output controls can do, and how you can use them. You are encouraged to take some more time to experiment with the various options in each of the controls (e.g., changing their appearance). Note that all of the controls have a separate tab (Attributes). Don’t worry about that yet. We will discuss that tab in a later Lesson.
When you are done experimenting, you can close this file, as we won’t be using it again.
